A topic that is attracting more and more attention in the cooling tower industry is PM10 and PM2.5 emissions. Reduced emissions to the environment are being required as governmental permitting regulations continue to get tighter. From a cooling tower perspective, this gets related to drift emissions; however, there is a bit of a chasm between drift rates and PM10 and PM2.5 values.
As a foundation for this discussion, there is a need to define PM10 and PM2.5. PM10 is Particulate Matter that is 10 microns (10×10-6m) in diameter or smaller. PM2.5 is Particulate Matter that is 2.5 microns (2.5×10⁻⁶m) in diameter or smaller. These size levels are of import due to health reasons; PM10 particles are small enough to be inhaled via the mouth and enter the deepest parts of the lungs, and PM2.5 particles are small enough to be inhaled via nasal passages. Since these particles can reach the furthest parts of the respiratory system, they can impact respiratory function by causing or worsening conditions such as asthma and bronchitis.
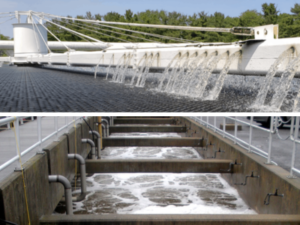
Drift rate is commonly listed as the emitted percentage of the circulating water flow rate through a cooling tower. However, the bottom line is that the listed percentage can be converted to a mass flow rate, whether that be listed as “lbm (or kg) of water per rate of time” or “gallons per minute (or liters per second)” based on the density of water. The link that needs to be accounted for in relating drift emissions – a certain mass of water – to a PM10 or PM2.5 emission – a certain mass of particulate – is the knowledge that the particulate matter resulting from a drift droplet equals the solids that are left behind after the water that forms the droplet evaporates. Those solids are a function of the size of the water droplet (and the volume of water that represents) that will eventually evaporate, and they are also a function of the concentration of dissolved solids (TDS – Total Dissolved Solids) in the water.
Larger water droplets contain more mass of dissolved solids than smaller droplets. Higher TDS concentrations contain more solids than lower concentrations. So, if you have big, fat droplets that are very high in TDS concentration, chances are the particulate matter that is created when the water evaporates will be larger than 2.5 and also 10 microns, and thus will not qualify as either PM2.5 or PM10 emissions. The finer the droplets and the more “pure” the water, the greater the chance that all emissions might be PM10 or PM2.5.
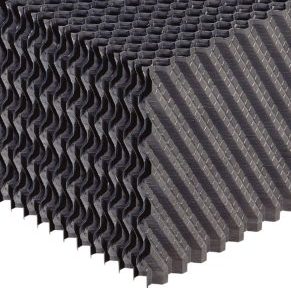
In the end, in order to truly calculate PM10 and PM2.5 emissions, you need to know droplet diameter/fractional efficiency information of the drift eliminators. This is affected by the air velocity and also the diameters of the droplets entering the drift eliminator, which means that nozzle information is required. TDS of the circulating water is another required parameter. The final pieces of information that are required are the air velocity profile of the drift eliminators and the drift rate performance as a function of velocity. With this data in hand, it is possible to calculate a reasonable estimate of PM10 and PM2.5 emissions.
With the continuing evolution of regulations and more widespread application of air permit limits in new jurisdictions, the cooling tower industry is just now starting to address these greater needs. Many drift eliminator manufacturers have not yet tested DE fractional efficiencies or drift rate vs. air velocity performances, and the emitted droplet spectra from various nozzles are mostly unknown. Brentwood began testing for some of this information years ago, and we will continue to test our products to provide the data required for these types of calculations as we lead the way forward.